Hello All,
If you have read some of my earlier posts, I focused a lot on the role of water in protein function. The plots in this post show that water locks an important amino acid into position.
After inserting water into the simulation, then quantifying how much time water spent in the enzyme active site, I examined the dynamics of other amino acids relative to the water location.
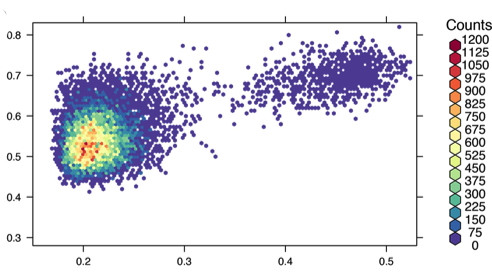
First, I used the GROMACS Molecular Dynamics (MD) suite to output distances between water and another atom inside the protein, indexed with time. Then I did the same for a amino acid know to be key in the signal transduction function of this protein. I had to write a python script to extract the relevant data from the MD output, and turn it into .csv format. I plotted these with time as a parameter using the R package hexbinplot, with a color ramp to indicate counts in each bucket. I polished the plot up with colorbrewer, making it more aesthetically appealing.
(caption below)

A: Mutant protein, it is locked into one conformation. Why the mutant does this is beyond the scope of this post. But this figure shows that the amino acid is indeed locked into one place.
B: Wild type protein. The low population island in the upper right represents the signaling state, and the main density in the left is the non signaling state.
C: Snapshot of the simulation showing the water pushing the amino acid out into the signaling state. This image is a representation of what the island in B looks like
[…] For my post with a nice looking arrangement of 2 variables linked with a parameter: pretty heatmap of hexagonally binned data […]